Sonowall 70 B-scan Data Report
Sonowall 70 B-Scan data can be exported and graphed in a report showing minimum, maximum and average thickness readings.


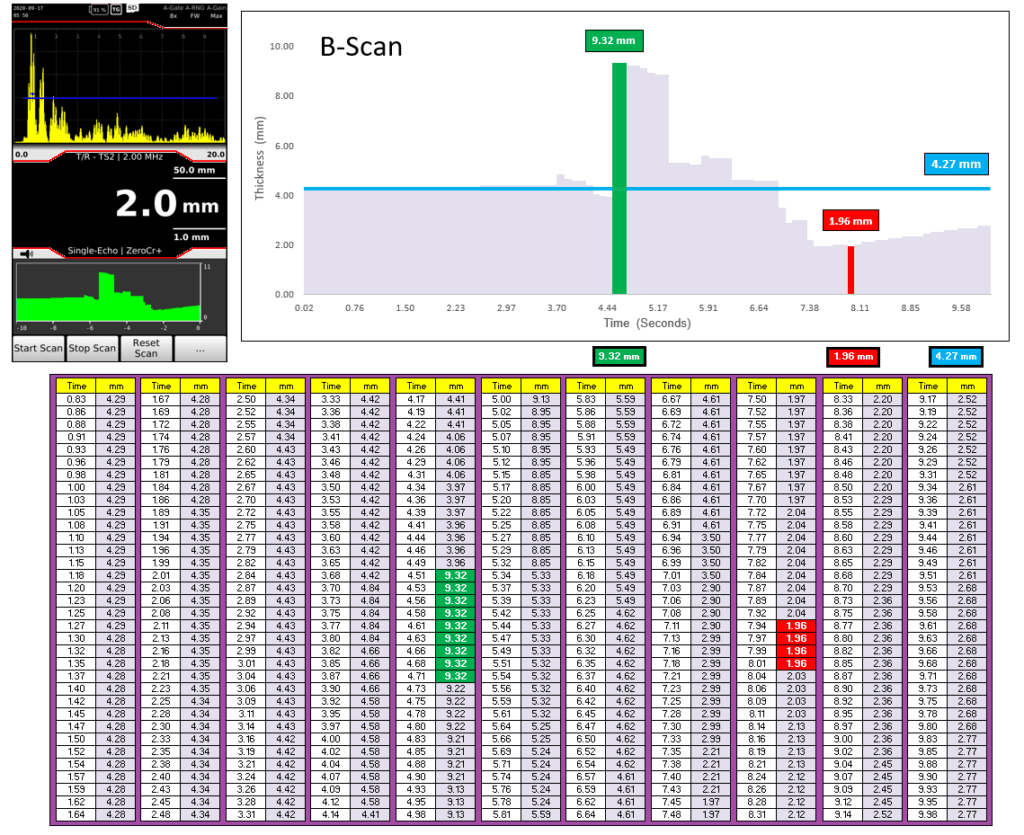
The above example shows the raw data, a chart of the B-scan and the B-scan display on the Sonowall 70. The results are from a timed 10 second B-scan. The chart shows the maximum ( Green 9.32 mm), minimum ( Red 1.96 mm ) and average ( Blue Line 4.27 mm ). The same colors are automatically highlighted in the raw data.